
Salesforce - How to Track Record Save Performance Details Using Log Inspector
When your Salesforce instance is growing with lots of customization, there are high chances that you might hit performance issues with respect to Record save time. Salesforce is providing with out of the box approaches to track and find out time consumed by each of your operation. Let us see how we can track that - with the help of a sample scenario - Contact record save operation.


Limits

Limits tab shows details of Governor Limits consumed by your current transaction.

Scenario - Customization On Contact Object
Let us consider 2 Customization on Contact Object.
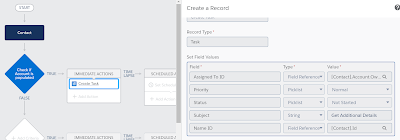
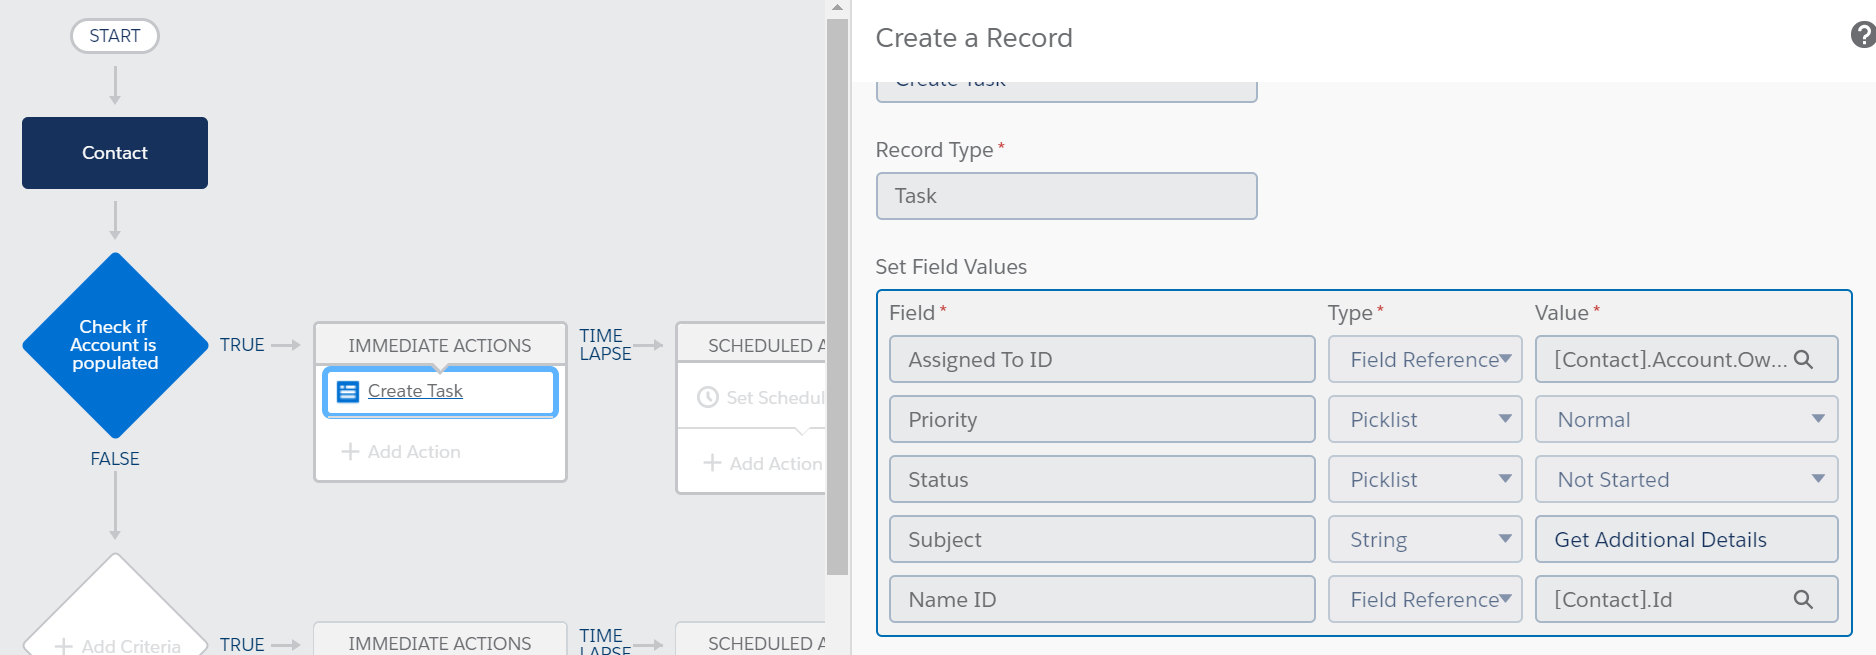
1. Assign Task to Account Owner - Process Builder
When a new Contact is created, assign a task to Account Owner asking to reach out to that Contact to get some additional details about him.
This can be achieved through a Process Builder as shown below:
2. Update Account Country from Contact to Country field in Account - Contact Trigger
Example :
Account - Account ABC
Contact 1 -> Country ->India
Contact 2-> Country->United States
Once the contacts are saved, Account Country value should be -> India, United States
This can be achieved using multiple approaches like Process builder+Flow, Process builder+Invocable Apex, Queueable Apex etc. Since we want to track performance of different solution scenarios, let us consider Trigger as a solution option for this.
Please see the Trigger Solution Below:

How to Track Performance Details
Follow below Steps to Capture Performance Details:
- Create new Debug Level
Make sure to follow below debug levels:
- Database - > FINEST
- Workflow -> FINER
- Apex Code-> FINEST
- Apex Profiling -> FINEST

2. How to Capture Performance Details
- Once a new Contact is Saved, open the debug in Developer Console
- Go to Debug->Switch Perspective->Analysis(PreDefined)
Debug View - Log Inspector Details
Once you are switched to this view, you will be able to see below details
1. Stack Tree - Execution Tree & Performance Tree
Stack Tree contains 2 views - Execution Tree and Performance Tree
Execution Tree

Execution tree shows time consumed by each statement. For example if we have a For loop inside a trigger, execution tree shows time consumed by each of these iteration .
Performance Tree

Performance Tree shows duration and heap details at operation Level. For example if we have a workflow and a trigger, we can see an aggregated view for each of this.
2. Execution Stack

If we select a row from Performance Tree or Execution Tree - Execution Stack shows the bottom up view of that selected Row.
3. Execution Overview
Execution Overview has multiple tabs under it.
Save Order

Save Order shows color coded operation order Details:
| COLOR | TYPE |
| Red | Before Trigger |
| Orange | After Trigger |
| Green | Validation Rule |
| Blue | Assignment Rule |
| Purple | Workflow Rule |
Limits

Limits tab shows details of Governor Limits consumed by your current transaction.
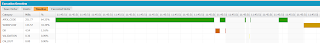
TimeLine

Timeline shows a visual representation of time consumed by each operation
Executed Units

This shows the system resources consumed by each of the process. This includes - number of times the statement got executed, time consumed, number of rows got processed, Heap consumed, Query type(SOQL Vs SOSL) etc.
Now lets us see how we can capture all these details in our Contact Save scenario. Watch the below video.
Let me know your questions/Comments about this post.


Thanks for valuable information
ReplyDeleteThank you Vamsi for the feedback.
DeleteThanks for providing great information 👍
ReplyDeleteThank you Surendranath for the feedback
Deletevaluable information!!
ReplyDeleteThank you Abhinav!
DeleteNice information, this is will helpfull a lot, Thank for sharing, Keep do posting i like to follow this
ReplyDeletesalesforce billing admin training online
thanks for valiable sales force information
ReplyDeleteSalesforce Billing Online Training. Contact us @ +91 9550102466.
Thank you so much for sharing this valuable information.
ReplyDeleteSalesforce CPQ Training
Salesforce CPQ Online Training
Thanks for your information. very good article.
ReplyDeleteCPQ Salesforce Training
Salesforce CPQ Course
Thank you for sharing n wonderful post with us.
ReplyDeleteSales Force tracker
Thanks for sharing this informative article on Salesforce - How to Track Record Save Performance Details Using Log Inspector. If you want to Salesforce Services for your project. Please visit us.
ReplyDeleteI have read many articles here and learned many things from them, this was really helpful for me. Thank you so much for sharing this info with us and keep sharing your ideas with us.
ReplyDeleteI want to introduce the Salesforce tool FLOWACE.
Tracking record save performance details in Salesforce is crucial for optimizing system efficiency. Flowace, integrated with Salesforce, provides advanced tools like Log Inspector to monitor and analyze these details. It enhances your ability to fine-tune Salesforce performance, ensuring a seamless experience for users and efficient data management
Nice blog
ReplyDeleteManaging Staff Augmentation Services for Success | TechTriad
Nice blog, thank you for sharing this information with us.
ReplyDeleteLeading Staff Augmentation Services In The USA.
This blog is a great guide for tracking record save performance in Salesforce using Log Inspector. It explains how to create debug levels and use the Developer Console to analyze performance. The detailed steps and examples, like assigning tasks to Account Owners and updating Account Country fields, make it easy to understand and implement. If you're interested in IT staff augmentation, checkout our web-stories Benefits of IT staff augmentation
ReplyDeleteThis comment has been removed by the author.
ReplyDeleteNice information, this is will helpfull a lot, Thank for sharing, Keep do posting i like to follow this
Deletehttps://onlineitguru.com/salesforce-billing-training